Difference between revisions of "Repeat rate and inventory of phonemes"
| (4 intermediate revisions by one other user not shown) | |||
| Line 51: | Line 51: | ||
<div align="center">[[Image:Tabelle1_RRAIOP.jpg]]</div> | <div align="center">[[Image:Tabelle1_RRAIOP.jpg]]</div> | ||
| + | |||
'''3.2. From the Zipf-Mandelbrot distribution''' | '''3.2. From the Zipf-Mandelbrot distribution''' | ||
| Line 70: | Line 71: | ||
which can be seen in Fig. 2. The results of fitting are in Table 2. The parameter B could not be interpreted as yet. It must be computed anew at any enlarging of the stock of examined languages. | which can be seen in Fig. 2. The results of fitting are in Table 2. The parameter B could not be interpreted as yet. It must be computed anew at any enlarging of the stock of examined languages. | ||
| − | <div align="center">[[Image:Tabelle2_RRAIOP.jpg]]</div | + | <div align="center">[[Image:Tabelle2_RRAIOP.jpg]]</div> |
| − | Both results are satisfactory. However, other formulas in Phoneme frequency (<math>rightarrow | + | Both results are satisfactory. However, other formulas in Phoneme frequency (<math>\rightarrow</math>) can be tested, too. Of course, the best fit follows from <math>R = aK^{-b}</math> but considering the fact that the data are very mixed (letters, phonemes, texts, dictionaries, different interpretations etc.) the result is a preliminary stimulus for further research. |
<div align="center">[[Image:Grafik1_RRAIOP.jpg]]</div> | <div align="center">[[Image:Grafik1_RRAIOP.jpg]]</div> | ||
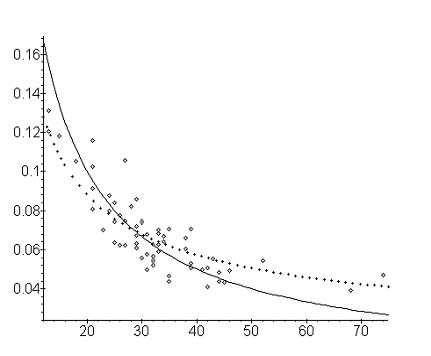
<div align="center">Figure 2. Fitting formulas (8) –––––– and (11) -------- to Repeat rates in 63 languages</div> | <div align="center">Figure 2. Fitting formulas (8) –––––– and (11) -------- to Repeat rates in 63 languages</div> | ||
| − | '''4. Authors: G. Altmann, V. Kromer | + | |
| + | '''4. Authors:''' U. Strauss, G. Altmann, V. Kromer | ||
'''5. References''' | '''5. References''' | ||
Latest revision as of 14:36, 26 July 2006
1. Problem and history
The repeat rate is a measure expressing the diversity of relative frequencies of the elements of a closed system. For computing it, the data must be normalized, i.e. the functions used in ”Phoneme frequencies” ( ) must be considered probability functions. Its expression is
(1)
weher  , N being the number of phonemes in the sample, fx is the absolute frequency of phoneme x, K is the number of phonemes in the inventory (inventory size). The problem is to find whether R is associated with the inventory size K.
Lehfeldt and Altmann (1983) have shown that R is lawlikely joined with K if the frequencies are distributed according to the right truncated geometric distribution. Zörnig and Altmann (1983) have shown that the relation holds if the frequencies follow the Zipf-Mandelbrot distribution (see Ranking).
2. Hypothesis
The repeat rate of phonemes R is a monotone decreasing function of the phoneme invetory K.
3. Derivation
3.1. From the geometric distribution. Let the rank-ordered phoneme frequencies follow the 1-displaced right truncated geometric distribution, defined as
(2) .
.
with
(3)
from which
(4) .
.
For the Repeat rate we have
(5) .
.
Using (4) from which  one obtains
(6) .
.
The first approximation to a theoretical value of R is given by setting
(7) .
.
Inserting (3) and (7) in (6) and neglecting  which is very small as compared to the other values one obtains
(8) ,
,
i.e. the Repaet rate is a very simple function of the inventory size.
Example. Repeat rate for 63 languages
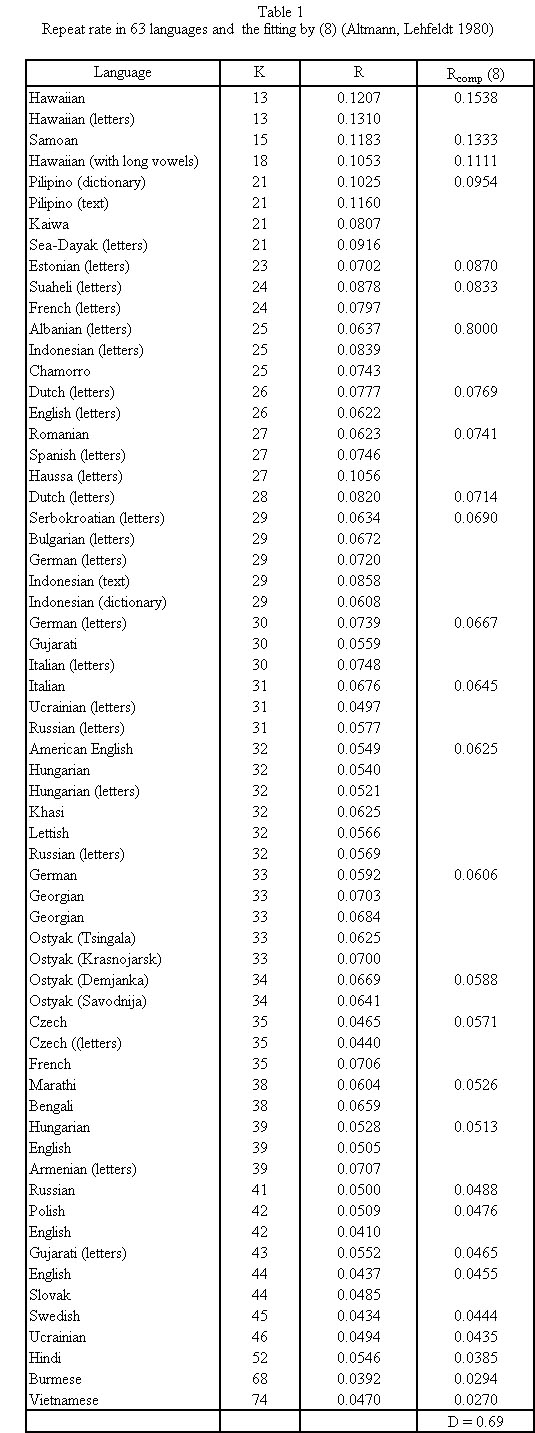
Altmann and Lehfeldt (1980: 154-156) collected the R-values for 63 languages from the published literature and compared them with the theoretical value (8) . The result is shown in Table 1 and Figure 1. Some of the points concern letters, some are for phoneme in texts and in dictionary, in some cases alternative counting has been performed (e.g. considering long vowels as one or two phonemes, etc.).
3.2. From the Zipf-Mandelbrot distribution
Zörnig and Altmann (1983) used the Zipf-Mandelbrot distribution to derive R, i.e.
(9) .
.
Since 
where A is the normalizing constant. Using an approximation of the sum by an appropriate integral they obtained
(10)
By an iterative procedure they have shown that the best fitting to the existing data is the third formula in (10) i.e. with c = 1 and B = 0.61, thus
(11)
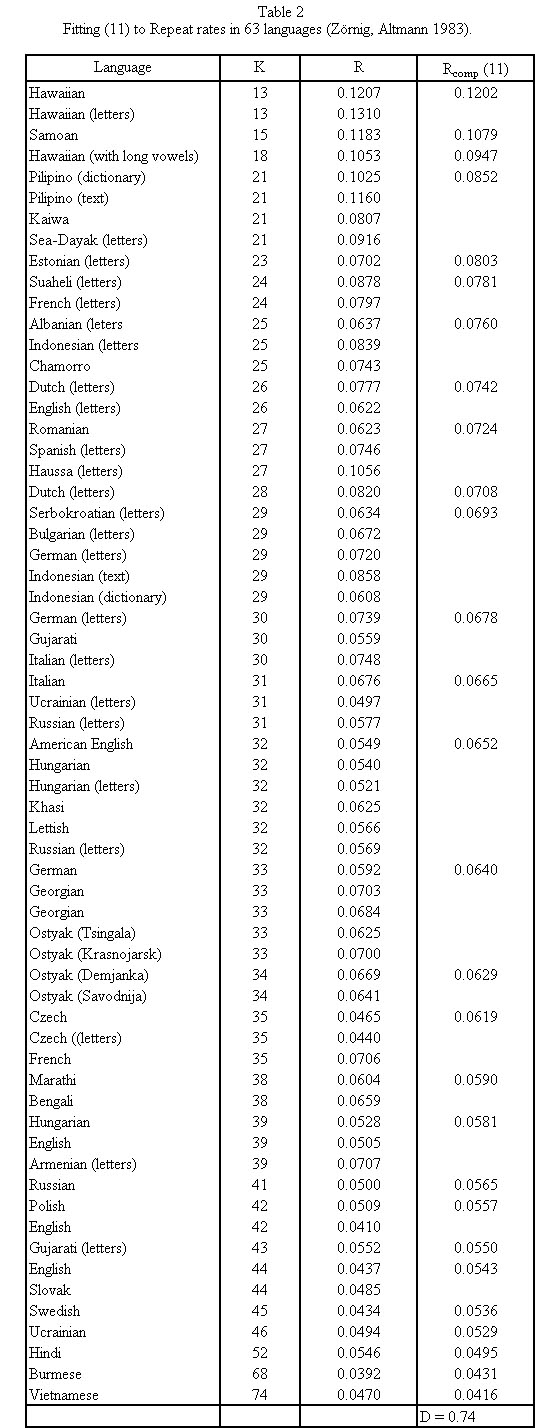
which can be seen in Fig. 2. The results of fitting are in Table 2. The parameter B could not be interpreted as yet. It must be computed anew at any enlarging of the stock of examined languages.
Both results are satisfactory. However, other formulas in Phoneme frequency ( ) can be tested, too. Of course, the best fit follows from
  but considering the fact that the data are very mixed (letters, phonemes, texts, dictionaries, different interpretations etc.) the result is a preliminary stimulus for further research.
4. Authors: U. Strauss, G. Altmann, V. Kromer
5. References
Altmann, G., Lehfeldt, W. (1980). Einführung in die quantitative Phonologie. Buchum: Brockmeyer.
Zörnig, P., Altmann, G. (1983). The repeat rate of phoneme frequencies and the Zipf-Mandel-brot law. Glottometrika 5, 205-211.
Zörnig, P., Altmann, G. (1984). The entropy of phoneme frequencies and the Zipf-Mandelbrot law. Glottometrika 6, 41-47.


