Difference between revisions of "Length of syntactic constructions"
m (Length of syntactic constructions: moved to Length of syntactic constructions) |
|||
| (One intermediate revision by one other user not shown) | |||
| Line 38: | Line 38: | ||
| − | '''4. Authors''': G. Altmann | + | '''4. Authors''': U. Strauss, G. Altmann |
Latest revision as of 11:27, 25 July 2006
1. Problem and history
The length of a syntactic construction is defined as the number of terminal nodes belonging to it, while complexity ( ) is he number of its immediate constituents. These two properties are interrelated.
The first distribution models were proposed by Köhler and Altmann (2000), no further development is known. As can be seen, the result is a special case of length ( ) distributions.
2. Hypothesis
The length of syntactic constructions abides by the positive negative binomial distribution.
3. Derivation
The quantities necessary for the derivation are shown in the chapter “Syntactic structures: Complexity” ( ). Here the requirement minX = 0, because length depends on complexity and minX is given implicitely. Using the approach proposed for modeling complexity we obtain
(1) .
.
Setting again maxH = k-1, E/I(K) = q (0 < q < 1) and solving (1) we obtain
(2)
If maxH tends to -1, i.e. k  0, we obtain the logarithmic distribution
(3)
but in particular cases it is necessary to modify the probability in x = 1 and one obtains the extended variants of (2) and (3), namely
(4)
(5)
Example: The length of syntactic constructions in the Susanne corpus
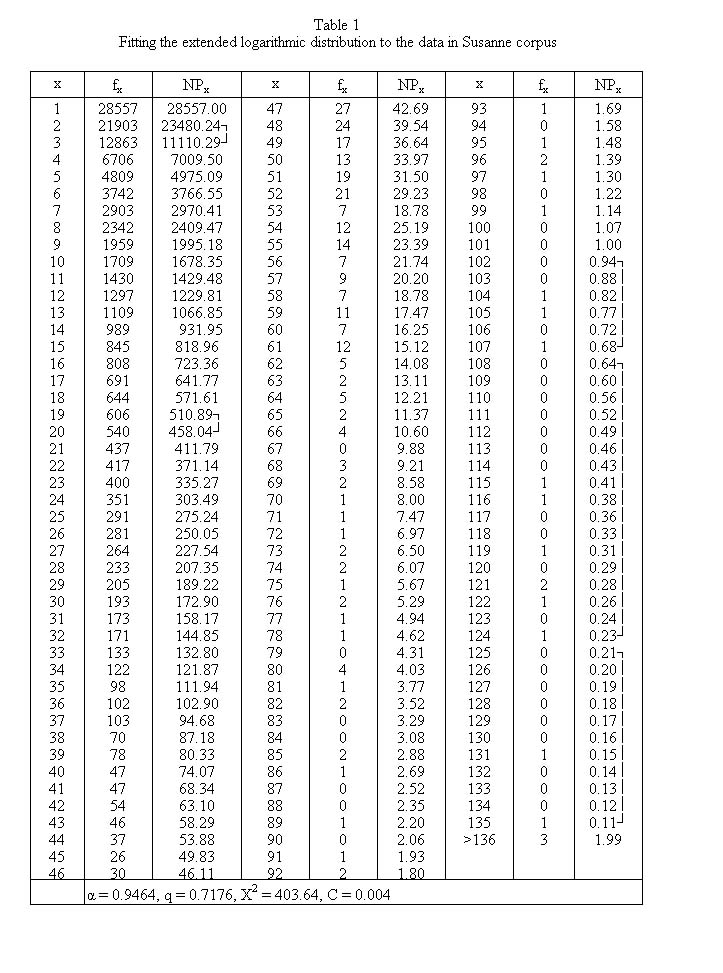
The result of fitting of the extended logarithmic distribution to the data in Susanne corpus are shown in Table 1 and Fig. 1 (Köhler, Altmann 2000).
Though the chi-square value is very high, the fit is satisfactory as shown by the value of C. The greatest divergence is in the middle range where one can observe strong fluctuation.
4. Authors: U. Strauss, G. Altmann
5. References
Köhler, R., Altmann, G. (2000). Probability distributions of syntactic units and properties. J. of Quantitative Linguistics 7, 189-200.
